


What is Data Analysis?
This guide introduces the core concepts of data analysis, its importance, and how it transforms raw data into actionable insights for smarter decisions.

In our increasingly digital world, we generate and collect vast amounts of data every second. From your daily step count to global sales trends, data is everywhere. But raw data, by itself, is just a collection of facts and figures. To truly harness its power, we need to apply Data Analysis.
At Functioning Media, we believe that understanding data is the first step to making truly informed decisions, whether for business strategy, product development, or personal insights. This guide will provide you with a beginner-friendly introduction to what data analysis is, why it's so important, and the fundamental steps involved in transforming raw data into meaningful knowledge.
What Exactly is Data Analysis? 🤔
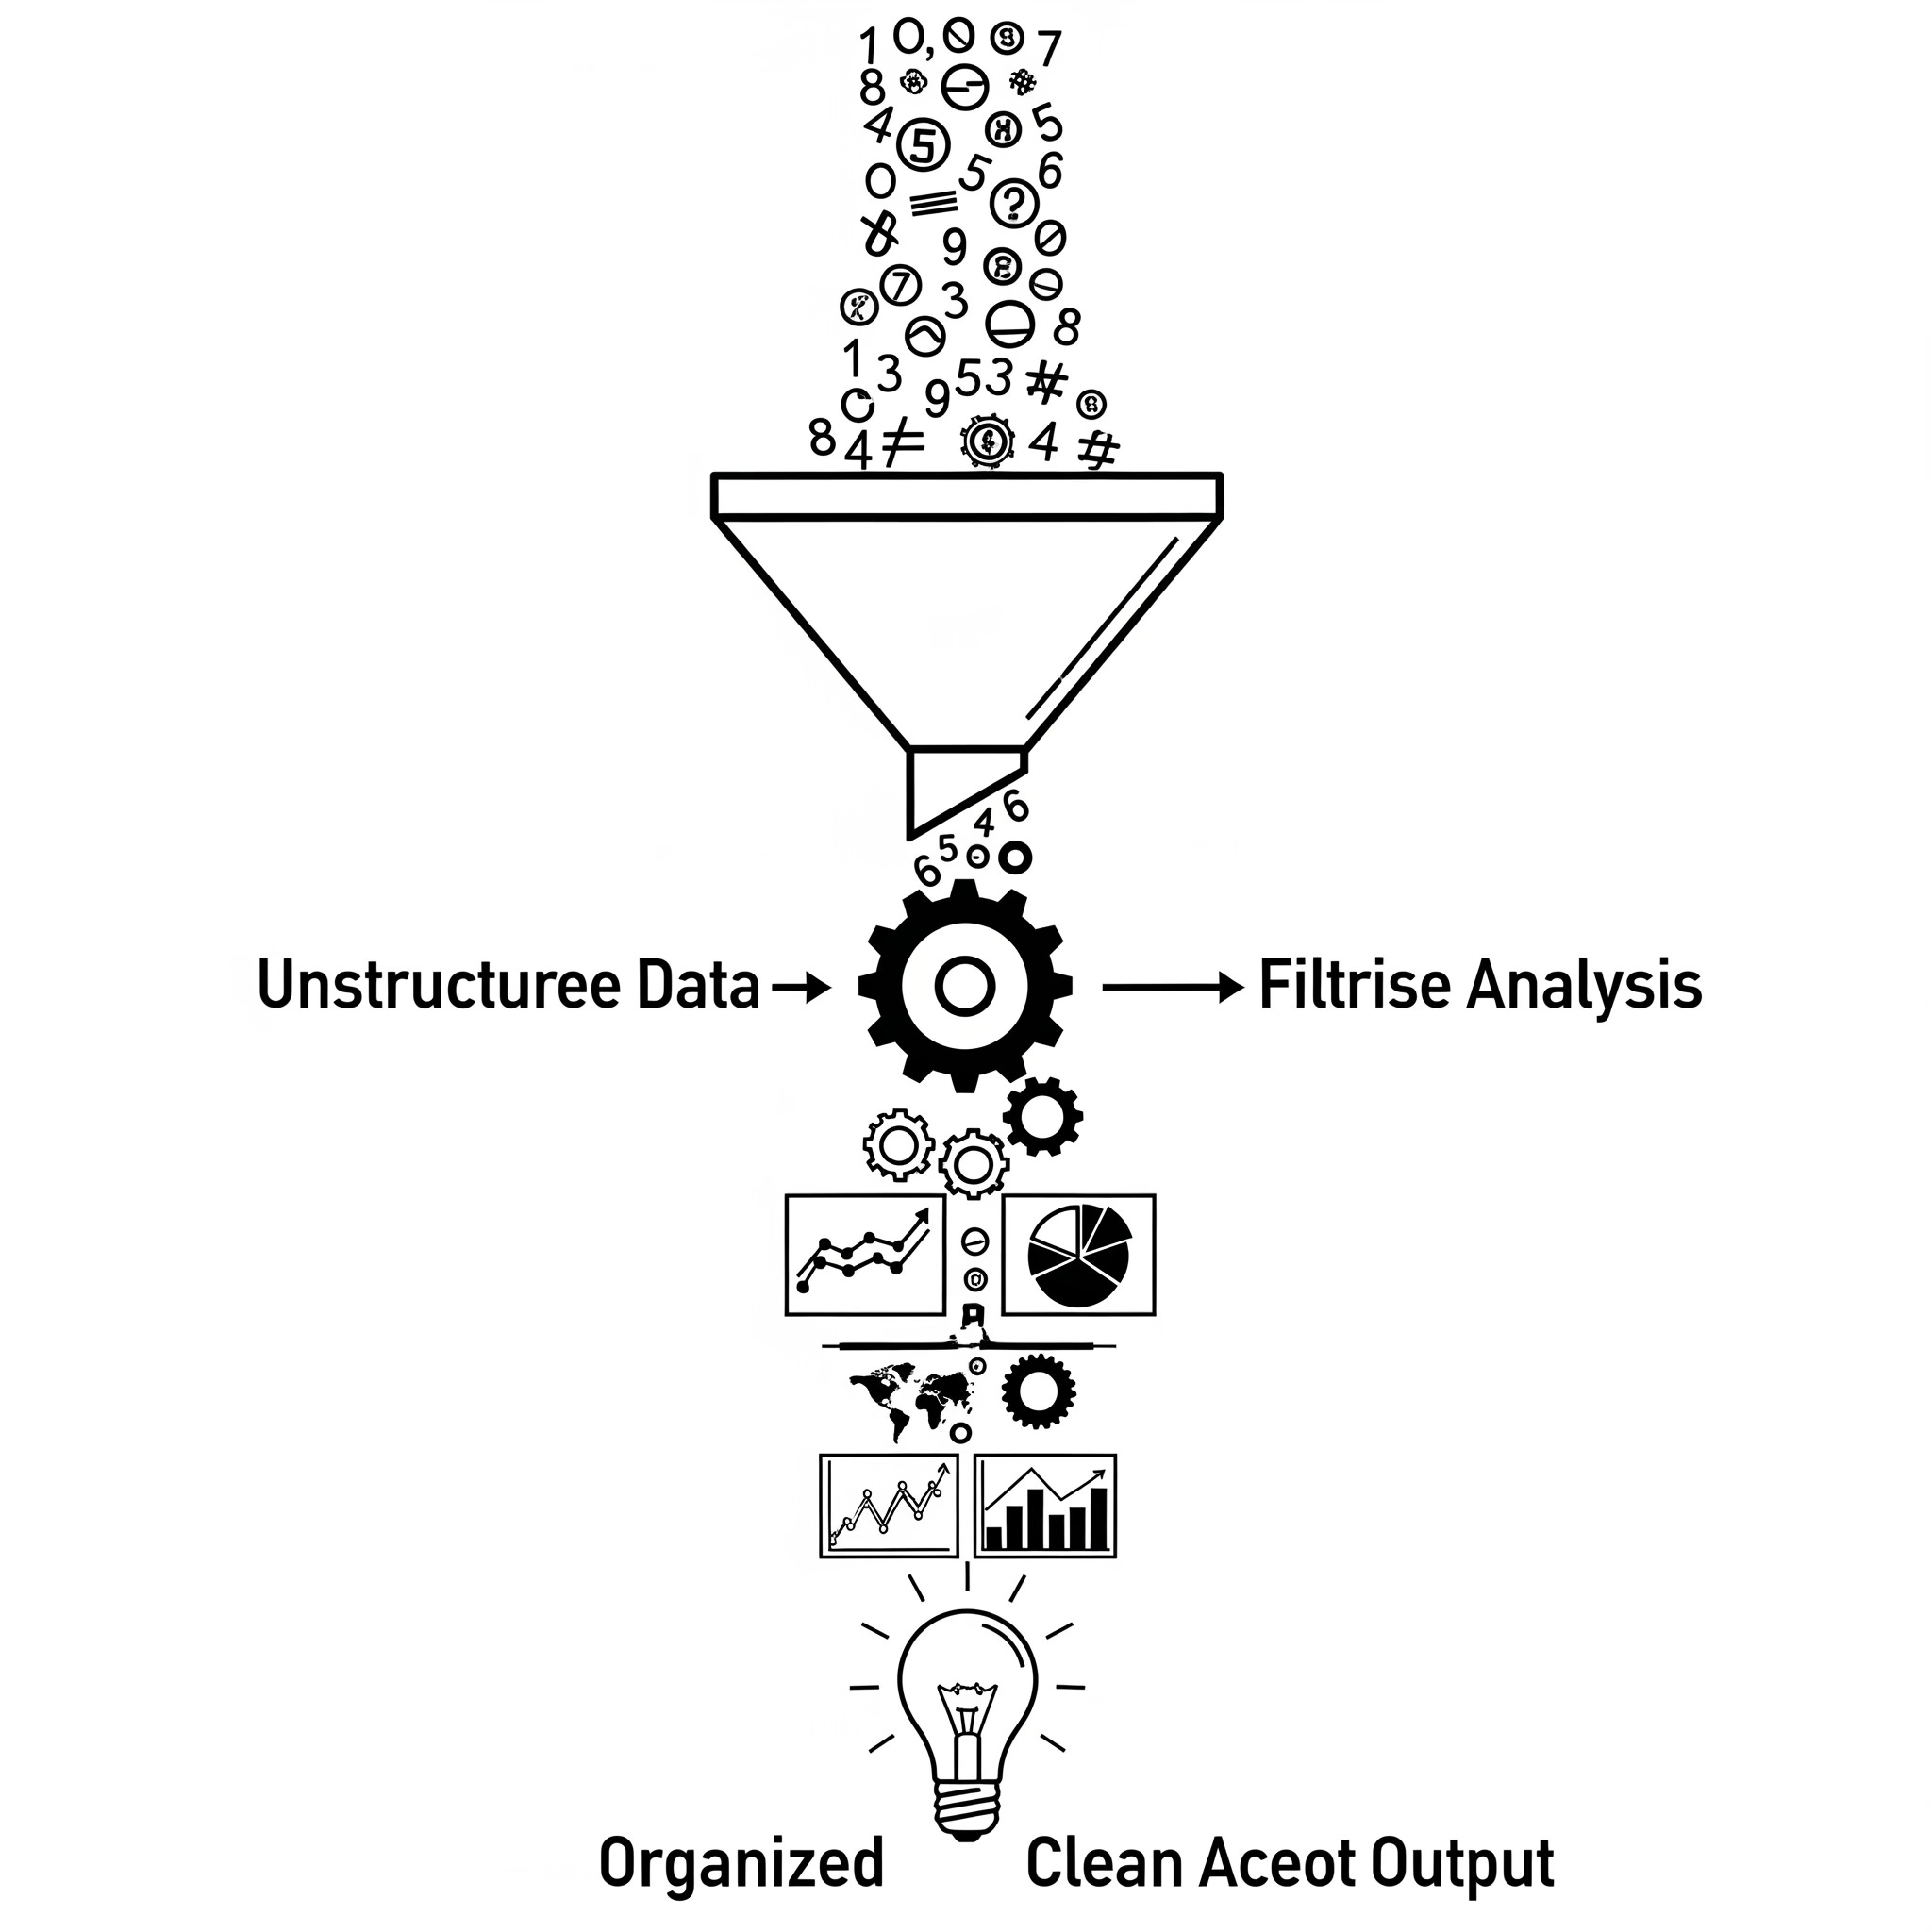
In its simplest form, Data Analysis is the process of inspecting, cleaning, transforming, and modeling data with the goal of discovering useful information, drawing conclusions, and supporting decision-making. Think of it as detective work: you gather clues (data), organize them, look for patterns, and then piece together a story that helps you understand what happened, why it happened, and what might happen next.
It's about turning noise into signal, data into information, and information into insight.
Why is Data Analysis So Important? 💪
In today's competitive landscape, relying on intuition alone is no longer enough. Data analysis empowers businesses and individuals to:
Make Informed Decisions: Instead of guessing, decisions are based on evidence and trends derived from data. This reduces risks and increases the likelihood of success.
Identify Trends & Patterns: Uncover hidden correlations, seasonal variations, and emerging patterns that might otherwise go unnoticed.
Understand Customers: Gain deep insights into customer behavior, preferences, and needs, leading to personalized experiences and improved products/services.
Improve Operational Efficiency: Pinpoint bottlenecks, optimize processes, and reduce costs by analyzing operational data.
Predict Future Outcomes: Use historical data to forecast future sales, market demand, or potential risks, allowing for proactive planning.
Solve Complex Problems: Break down intricate issues into manageable data points to find effective solutions.
Gain a Competitive Advantage: Businesses that effectively use data analysis can adapt faster, innovate more intelligently, and outperform competitors.
The Essential Steps in the Data Analysis Process 🛠️
While the specifics can vary, most data analysis projects follow a general lifecycle:
1. Define the Question/Problem: This is the crucial first step. What are you trying to achieve? What specific question do you want to answer, or what problem do you want to solve? A clear objective guides the entire process.
Example: "Why did our website's conversion rate drop last quarter?" or "Which marketing campaign yielded the highest ROI?"
2. Data Collection: Gathering all the relevant raw data from various sources. This could include databases, spreadsheets, surveys, website analytics tools, social media, or external APIs.
Example: Exporting website traffic data from Google Analytics, sales figures from a CRM, or customer survey responses.
3. Data Cleaning & Preprocessing: Often the most time-consuming step! Raw data is rarely perfect. This involves identifying and correcting errors, handling missing values, removing duplicates, and transforming data into a consistent, usable format. "Garbage in, garbage out" applies here – clean data is essential for accurate insights.
Example: Fixing typos, standardizing date formats, or deciding how to handle empty cells.
4. Data Exploration & Visualization: Start exploring the cleaned data to understand its characteristics. Use statistical summaries (like Mean, Median, Mode) and create visual representations (charts, graphs, dashboards) to spot trends, outliers, and initial relationships.
Example: Plotting daily website visitors over time to see trends, or creating a bar chart of product sales by region.
5. Data Modeling & Analysis: Apply statistical methods, algorithms, or other analytical techniques to the data to uncover deeper insights and answer your initial question. This might involve building models, running regressions, or performing advanced statistical tests.
Example: Running a correlation analysis between website traffic and sales, or building a predictive model for customer churn.
6. Interpretation of Results: Translate the findings from your analysis into clear, understandable insights. What do the patterns and relationships mean in the context of your original question? Are the results statistically significant?
Example: "The conversion rate drop was primarily due to a significant increase in bounce rate on product pages, suggesting a usability issue."
7. Communication of Insights: Present your findings effectively to stakeholders. This often involves storytelling with data, using clear visualizations, and providing actionable recommendations based on your insights. The goal is to facilitate data-driven decisions.
Example: A presentation to the marketing team highlighting the findings, recommending A/B tests for product page layouts.
Types of Data Analysis (A Quick Glimpse) 📊
While Data Analysis is a broad field, it generally encompasses four main types:
Descriptive Analysis: What happened? (e.g., "Our sales increased by 10% last quarter.")
Diagnostic Analysis: Why did it happen? (e.g., "Sales increased because of a successful social media campaign.")
Predictive Analysis: What might happen? (e.g., "Based on current trends, sales are predicted to increase by 5% next quarter.")
Prescriptive Analysis: What should we do? (e.g., "To maximize sales, we should allocate more budget to social media campaigns and launch a similar one next quarter.")
At Functioning Media, we empower businesses to leverage their data for strategic growth. From defining key metrics to visualizing complex trends, we help you transform raw data into a powerful asset that drives your success. Understanding the basics of data analysis is your first step towards a truly data-driven future.
Visit FunctioningMedia.com and subscribe to the newsletter.
#DataAnalysis #BeginnerGuide #DataScience #DataLiteracy #BusinessIntelligence #DataDriven #Analytics #Explainers #BigData #FunctioningMedia