


Understanding Different Types of Data and Their Applications in Data Science
The Raw Material of Insight: A Beginner's Guide to Unpacking Data Types for Powerful Data Science Applications 📊🔍

In the world of data science, data is the raw material, the foundation upon which all insights, predictions, and intelligent systems are built. Just as a chef needs to understand different ingredients to create a perfect dish, a data scientist must grasp the various types of data to effectively collect, clean, analyze, and model information. Not all data is created equal; its nature dictates the statistical methods, machine learning algorithms, and visualization techniques that can be applied to extract meaningful value.
For beginners venturing into data science, the sheer volume and diversity of data can be daunting. Confusion about qualitative versus quantitative, or nominal versus ordinal, can hinder effective analysis. However, a solid understanding of data types is fundamental to avoiding analytical errors, choosing the right tools, and ultimately deriving accurate and actionable insights. At Functioning Media, we believe in building strong foundations for data literacy. This guide will demystify the different types of data commonly encountered in data science, explaining their characteristics and illustrating their practical applications, so you can confidently begin your journey into data-driven discovery.
Why Understanding Data Types is Crucial for Data Science 🤔
Knowing your data types is like knowing your tools – essential for proper execution:
Correct Analysis Selection: Different data types require specific statistical tests and machine learning algorithms. Using the wrong one can lead to inaccurate results.
Appropriate Visualization: The way you visualize data depends heavily on its type (e.g., bar charts for categorical, scatter plots for numerical).
Effective Data Cleaning & Preprocessing: Handling missing values, outliers, or inconsistencies varies by data type.
Accurate Interpretation: Understanding the nature of your data helps you correctly interpret the insights you derive.
Feature Engineering: Knowing data types helps you transform raw data into features suitable for modeling.
Resource Optimization: Efficiently storing and processing data depends on understanding its structure and type.
The Main Types of Data in Data Science Explained 📊🔍
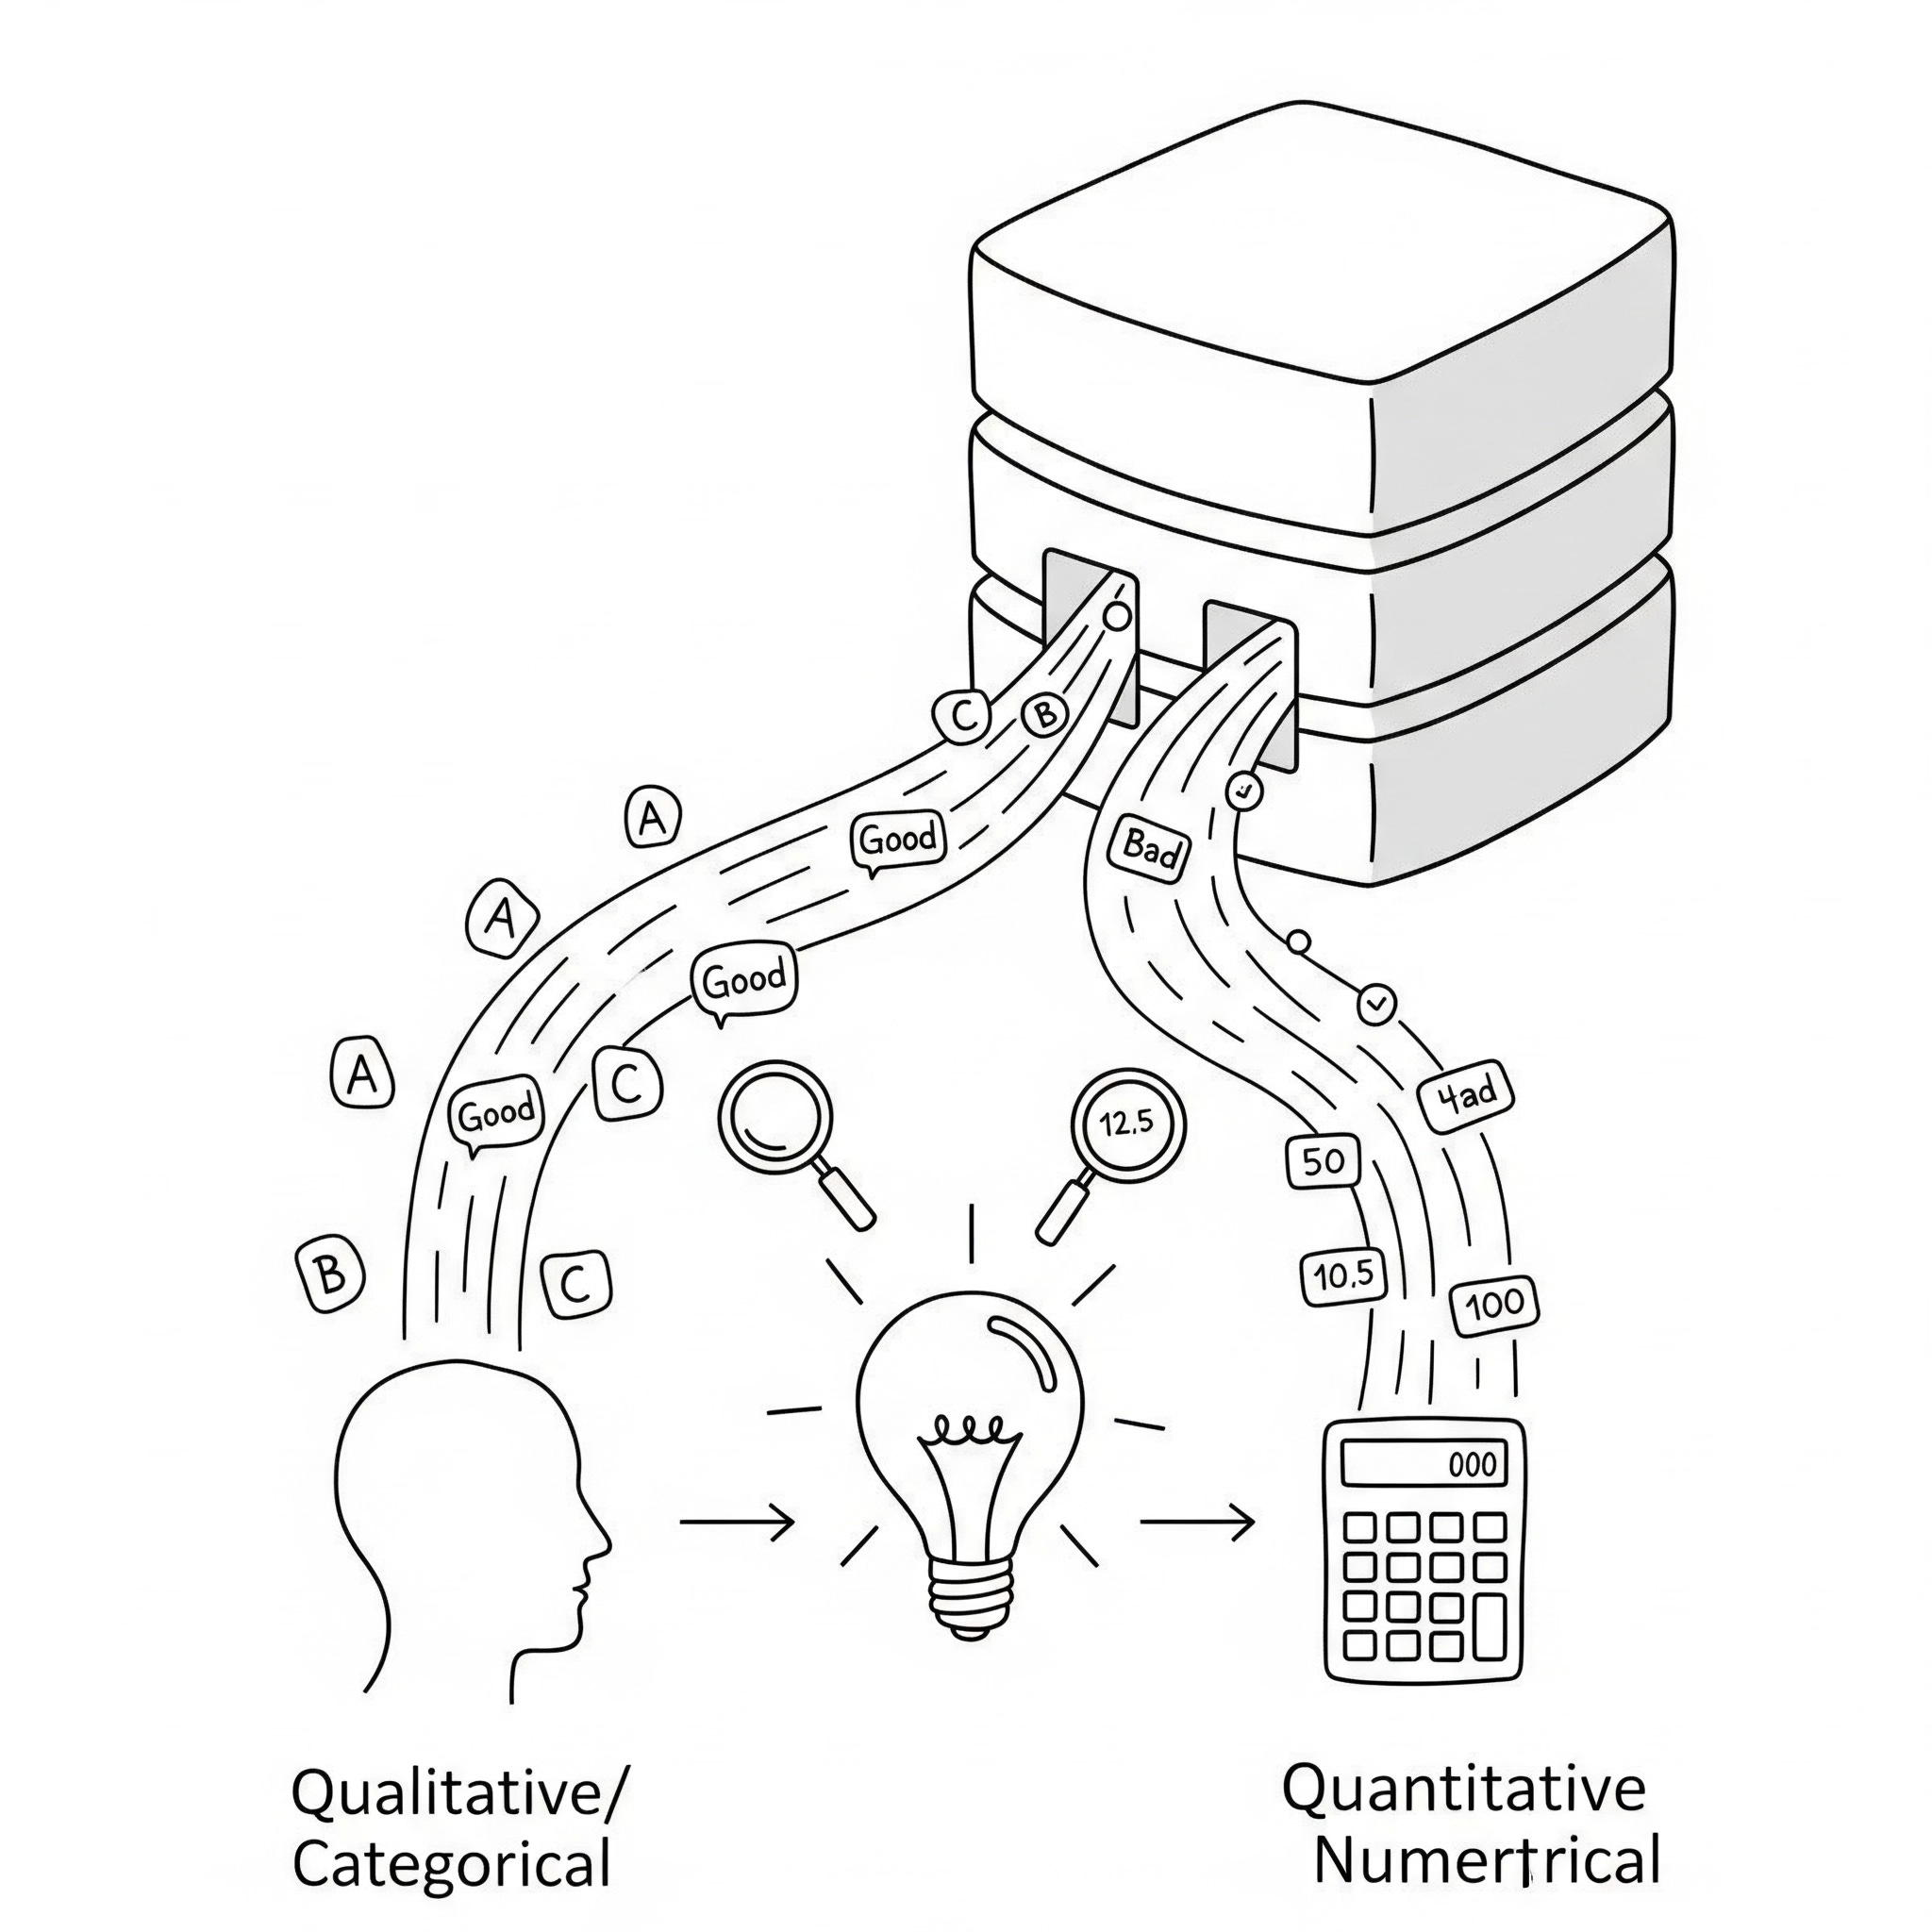
Data can generally be categorized into two main umbrellas: Qualitative (Categorical) and Quantitative (Numerical). Each of these further breaks down into sub-types, offering more granular distinctions.
I. Qualitative (Categorical) Data: "What Kind?" or "Which Category?" 🏷️
This type of data represents characteristics, qualities, or categories. It describes attributes or features that cannot be measured numerically.
1. Nominal Data
Definition: Data that consists of categories without any intrinsic order or ranking. It's used for naming or labeling variables.
Characteristics:
Categories are distinct and mutually exclusive.
No numerical value or order can be assigned.
Cannot perform mathematical operations (like addition or averaging).
Examples:
Gender: Male, Female, Non-binary
Hair Color: Brown, Black, Blonde, Red
Marital Status: Single, Married, Divorced, Widowed
Country of Origin: India, USA, UK, Germany
Yes/No Answers: (when representing distinct choices, not a binary value for calculation)
Applications:
Surveys: Collecting demographic information.
Customer Segmentation: Grouping customers by region or product preference.
Frequency Counts: Counting how many people fall into each category (e.g., number of customers per country).
Visualization: Bar charts, pie charts.
2. Ordinal Data
Definition: Data that consists of categories with a meaningful order or rank, but the intervals between the ranks are not necessarily equal or quantifiable.
Characteristics:
Categories have a natural order.
The difference between ranks isn't uniform or measurable.
Cannot perform meaningful mathematical operations beyond ordering.
Examples:
Education Level: High School, Bachelor's, Master's, PhD (PhD is higher than Master's, but the "distance" isn't fixed).
Customer Satisfaction: Very Unsatisfied, Unsatisfied, Neutral, Satisfied, Very Satisfied (Likert scale).
Economic Status: Low, Medium, High.
Movie Ratings: 1-star, 2-star, 3-star, 4-star, 5-star.
Applications:
Surveys & Feedback: Measuring attitudes and opinions.
Ranking: Prioritizing items based on perceived quality or importance.
Segmentation: Grouping customers by their satisfaction levels.
Visualization: Bar charts, ordered bar charts.
II. Quantitative (Numerical) Data: "How Much?" or "How Many?" 🔢
This type of data represents measurable quantities. It is expressed in numbers and can be used for mathematical computations.
1. Discrete Data
Definition: Numerical data that can only take on specific, distinct, finite values. It typically represents counts.
Characteristics:
Countable (whole numbers).
Finite number of possible values between any two given values.
Cannot be subdivided meaningfully (e.g., you can't have 2.5 children).
Examples:
Number of Students in a classroom (10, 20, 30, etc.)
Number of Cars in a parking lot.
Number of Website Clicks.
Number of Defects in a product batch.
Applications:
Counting occurrences: E.g., customer complaints, website visits.
Inventory management: Tracking items in stock.
Quality control: Counting defective products.
Visualization: Bar charts, histograms.
2. Continuous Data
Definition: Numerical data that can take on any value within a given range. It typically represents measurements.
Characteristics:
Infinite number of possible values between any two given values.
Can be precisely measured (e.g., height can be 1.75 meters, 1.755 meters, etc.).
Often involves fractions or decimals.
Examples:
Height: 1.75 meters, 1.83 meters.
Weight: 65.2 kg, 78.9 kg.
Temperature: 25.5°C, 98.6°F.
Time: 1.5 hours, 3.25 seconds.
Sales Revenue: $15,345.78.
Applications:
Scientific Measurements: Tracking physical phenomena.
Financial Analysis: Analyzing stock prices, revenue.
Performance Monitoring: Tracking system response times, energy consumption.
Visualization: Histograms, scatter plots, line graphs, box plots.
Why the Distinction Matters for Data Science Operations 💡
The type of data dictates your approach to key data science tasks:
Data Cleaning: How you handle missing values or outliers (e.g., imputing mean for continuous vs. mode for nominal).
Statistical Analysis: You can calculate the average for continuous data, but not for nominal data. You might use chi-square for categorical data relationships and t-tests for numerical data comparisons.
Machine Learning Models:
Regression models are used for predicting continuous outcomes.
Classification models are used for predicting categorical outcomes (nominal or ordinal).
Clustering algorithms work differently for numerical vs. categorical features (often requiring one-hot encoding for categorical).
Feature Engineering: Converting categorical data into numerical representations (e.g., one-hot encoding) is common before feeding it into many machine learning models.
Understanding these fundamental data types is the first step towards becoming a proficient data scientist. It empowers you to select the correct analytical methods, interpret your findings accurately, and build more robust and insightful data models. As you delve deeper, you'll find that real-world data often presents a mix of these types, requiring a flexible and informed approach to extract its full potential.
Ready to confidently navigate the world of data and unlock its hidden insights? Visit FunctioningMedia.com for expert data science training, consulting, and solutions tailored to your unique data challenges. Let's transform your raw data into actionable intelligence!
#DataScience #DataTypes #BeginnerDataScience #QualitativeData #QuantitativeData #NominalData #OrdinalData #DiscreteData #ContinuousData #DataAnalysis #FunctioningMedia #FunctioningData